
Tracking deliverability means watching what happens to your email after it leaves your platform: whether the receiving server accepts it, whether it reaches the inbox rather than spam, and whether the people there respond. The practical way to do it is to measure each mail stream separately (marketing, transactional and lifecycle), hold a baseline of what normal looks like, and review a small set of signals on a fixed rhythm, so that a drop becomes visible in days rather than at the end of the quarter.
Most teams already track something, usually opens, clicks and the delivery rate on the platform dashboard. The trouble is that those numbers describe what your platform can see, and the most important failures happen after the message has “left the building”. This guide sets out what to track, how often, and how to work out what has gone wrong when the numbers move.
Table of Contents
- Start with what your platform is not telling you
- Delivery, deliverability and engagement: three different measurements
- The five things worth watching
- Is a 25% open rate good?
- Build a baseline before you change anything
- A simple review rhythm
- How to investigate a sudden drop
- Mistakes that make tracking misleading
- Preparing for peak sending
- When to bring in a specialist
- FAQ
- Sources
Start with what your platform is not telling you
The delivery rate in most dashboards is the percentage of messages that were not bounced, which is a statement about the receiving server and nothing else. Adobe’s deliverability documentation makes the same distinction: it describes deliverability through the delivered rate and inbox placement, and notes that a high delivered rate is not the only facet. Put plainly, a server can accept your email and then quietly discard it into the junk folder, and your dashboard will log that as a success.
This is why a campaign can show 99% delivered and still produce a thin trickle of clicks. If most of the mail is going to spam, the people who would have clicked never saw it. Nobody has complained, nothing has bounced, and the report looks healthy, which is exactly why teams spend weeks rewriting subject lines when the problem sits upstream.
So the first job in tracking deliverability is to add the views your platform does not show you by default: authentication results, reputation with the major mailbox providers, complaint rates, bounce reasons and the origin of the addresses you are mailing. We tend to think of it as separating three questions: did the email reach the mailbox provider (reach), is it going to the right people (audience), and did they care once they saw it (message)? Content only gets blamed fairly once the first two have been answered.
Delivery, deliverability and engagement: three different measurements
The three terms get used interchangeably in meetings, and that is where the confusion starts.
- Delivery means the receiving server accepted the message. A hard or soft bounce is a failure at this stage.
- Deliverability is whether accepted mail reaches the inbox or the intended folder, as opposed to spam or a promotions tab nobody reads.
- Engagement is what recipients do next: open, click, reply, delete unread or report it as spam.
They are linked, because mailbox providers use engagement as one input when deciding where future mail should go. Spotler’s guide to inbox placement lists the key signals as sender authentication (SPF, DKIM and DMARC), sending consistency, recipient engagement, and complaints and bounces. That list is a useful skeleton for a tracking plan, because each item can be measured and each one has a different owner in your organisation: authentication usually sits with IT or engineering, consistency with whoever schedules campaigns, and engagement with the lifecycle or CRM team.
The five things worth watching
You do not need thirty charts. For most UK senders in SaaS, ecommerce and fintech, five groups of signals cover the ground.
1. Bounces, split by type
Separate hard bounces (the address does not exist or is permanently refused) from soft bounces (a temporary issue such as a full mailbox). Klaviyo’s UK guide describes the deliverability rate as emails delivered divided by emails sent, multiplied by 100, and draws the same hard and soft distinction. A rising hard bounce rate on a particular import usually points at list quality, whereas a rise in soft bounces that mention rate limiting or reputation points at how you are sending. The reason codes in your logs matter more than the headline percentage, so look at them, not only at the total.
2. Spam complaints
Complaints are the loudest signal a mailbox provider receives. Google states that bulk senders become eligible for mitigation when their spam rate stays below 0.3% for seven consecutive days, and that you can monitor your spam rate in Postmaster Tools. Treat 0.3% as the line you must never approach rather than a target. Brafton’s UK guidance puts a healthy programme at a deliverability rate of 95% or higher with complaints below the typical 0.2% threshold, and your own baseline will usually sit well under both.
3. Authentication results
SPF, DKIM and DMARC are the entry ticket. Google’s sender guidelines state that for bulk senders a missing DMARC record, or marketing mail without one-click unsubscribe, leaves you without delivery support or mitigation, and that unsubscribe requests must be honoured within 48 hours. Tracking here means reading your DMARC aggregate reports to see every source that sends as your domain, which ones pass alignment, and which are unknown. Unknown senders are frequently a forgotten tool, an old agency or a marketing platform someone connected without telling IT. If you want the mechanics behind each protocol, our guide to SPF, DKIM and DMARC explained walks through them in plain terms.
4. Inbox placement and provider reputation
This is the hardest to see and the most valuable. Postmaster-style dashboards from the large mailbox providers show domain reputation, spam rate and authentication for the mail they receive from you. Seed testing, where you send to test mailboxes at different providers and see whether the message lands in the inbox, promotions or spam, gives you a direct read on placement. Neither is perfect (dashboards only show volume above certain thresholds, and seed addresses do not behave like real recipients), so the sensible approach is to use both and treat disagreement between them as a prompt to investigate.
5. Engagement, read with care
Opens, clicks, click-to-open rate and unsubscribes all belong on the dashboard, but they need interpreting. Voyado’s KPI definitions separate delivery KPIs from engagement KPIs and warn that opens can be inflated by false opens from Apple Mail Privacy Protection, spam filters and preview panes. Clicks, replies and downstream conversions are firmer evidence that a human saw the message.
Is a 25% open rate good?
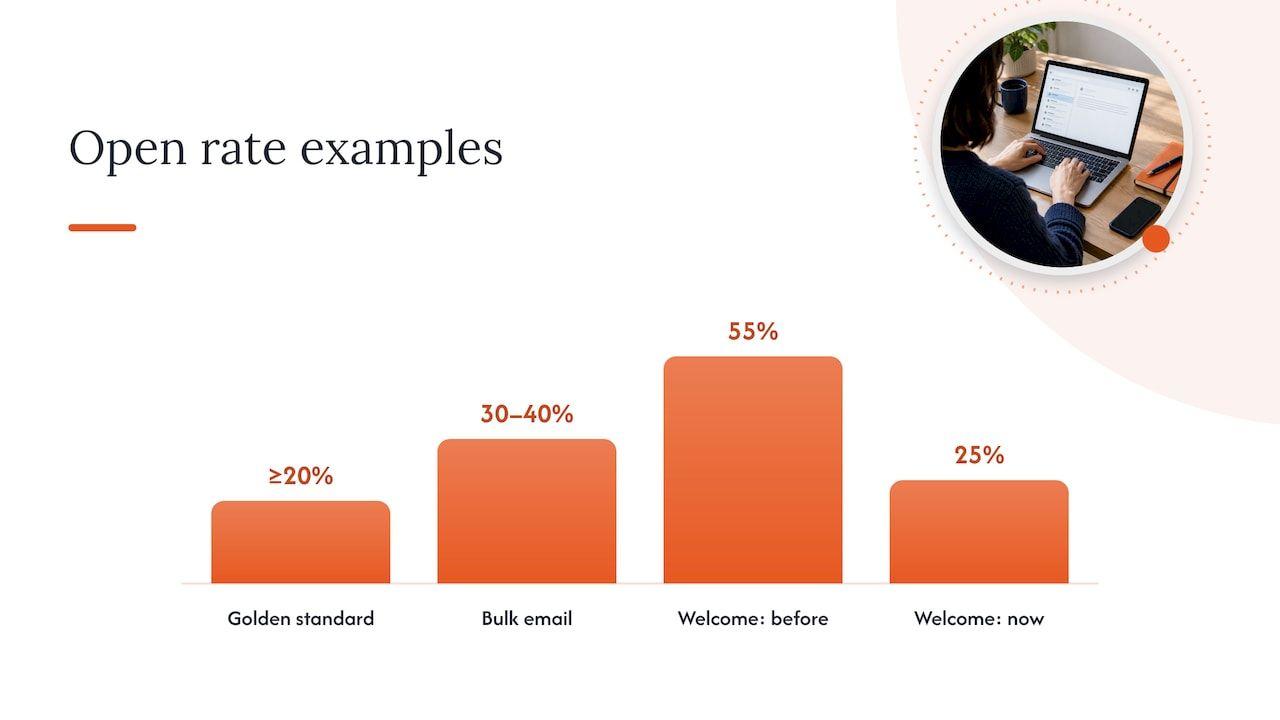
It depends on what is being measured and who is being mailed, which is an unsatisfying but honest answer. Bloomreach’s documentation describes at least 20% as a golden standard and says senders with good list health and an engaged audience typically reach 30 to 40% on bulk emails. On that yardstick 25% looks respectable, and for a cold or lapsed segment it may be excellent.
The more useful question is whether 25% is normal for that stream, and whether it moved. A welcome series that has run at 55% for a year and now sits at 25% has a problem, whereas a win-back campaign at 25% may be performing well. Because privacy features can open messages automatically, a flat open rate can also hide a deliverability slide: the machine opens keep the number steady while real readers disappear. That is why we pair opens with clicks, conversions and placement tests rather than relying on any single figure.
Build a baseline before you change anything
You cannot recognise a meaningful change if you do not know what normal looks like. That is the premise of howto.email’s baseline guide, which recommends tracking by major mail stream: attempted and accepted volume, temporary and permanent failures, common enhanced status codes, complaint signals, authentication results, DMARC source trends, provider-specific reputation indicators, and queue age and depth.
A practical version looks like this:
- Split your streams. Marketing, transactional (receipts, password resets) and lifecycle (onboarding, abandoned basket, renewal) behave differently and should never be averaged together. A healthy password-reset stream can mask a failing newsletter.
- Capture at least four weeks. Volanea’s deliverability plan recommends at least four weeks of data per stream before major changes, broken down by mailbox domain where volume allows, with significant sends reviewed daily and providers and streams compared weekly.
- Record the ordinary swings. Month-end, payday, a Black Friday week and the January sales all alter volume and engagement. A baseline that includes one of those periods stops you reading a seasonal bump as an incident.
- Write down the thresholds. Decide in advance what counts as an alert, for example a complaint rate that doubles week on week or a sudden jump in deferrals at one provider, and who is told.
The four-week baseline also helps outside email. If you are already pulling sends, failures, complaints, engagement and conversions into one view, it fits neatly beside the wider lean marketing tool stack a growth-stage team maintains, so deliverability stops being a separate world that only one person understands.
A simple review rhythm
The cadence matters as much as the metrics. This is a sensible starting point for a team sending at meaningful volume.
| Frequency | What to review | Why |
|---|---|---|
| Daily | Large sends: bounces, deferrals, complaints, provider spam rate | Problems compound quickly once a provider starts throttling you |
| Weekly | Streams and providers compared against baseline; DMARC sources | Slower drifts and new unknown senders show up here |
| Monthly | Inbox placement tests, list ageing, suppression rules, authentication changes | Confirms that the fixes you made are actually holding |
| Before peak periods | Warm-up needs, volume plan, lifecycle overlap | Black Friday and January sales punish unprepared senders |
If the daily and weekly checks feel heavy, that is normal, and it is the reason many teams give the task a named owner. Our own piece on what email deliverability monitoring actually looks like covers how that works in practice.
How to investigate a sudden drop
When results fall and nobody can say why, the instinct is to open the email editor. Resist it for a day, because the cause is often not the content. A calmer sequence works better.
Check authentication and infrastructure first
Look at whether SPF, DKIM and DMARC still pass for every stream. A DNS change, a new tool sending on your behalf or an expired key can break alignment overnight, and the effect shows up as spam placement rather than as an error. Also confirm that nothing has changed in your sending infrastructure, such as a new IP, a platform migration or a shared pool that has been affected by someone else’s behaviour.
Check reputation and complaints
Open your provider dashboards and compare the spam rate and domain reputation to the baseline. If one provider has moved and the others have not, the problem is probably specific to that provider’s view of you. If all have moved together, look at what you changed in the same period.
Join events to sources
This is the step teams skip. As one analysis of bulk sender monitoring argues, effective monitoring is less about adding dashboards and more about joining email event data to acquisition sources so you can see which sources are driving the problems. A competition entry list, an old import or a partner co-registration can generate most of your complaints while representing a small share of your volume. Without the join, the average hides the culprit.
Look at overlapping lifecycle triggers
A customer who has just bought can, in the same week, receive an abandoned-basket nudge, a post-purchase series, a review request and a promotional newsletter. Each flow looks reasonable on its own. Together they raise complaints and cut engagement, which then drags down placement for everything else you send, including the transactional mail that people actually need. Map every trigger against a single customer timeline and set suppression rules between flows.
Then, and only then, consider the message
If reach and audience are sound, content becomes a fair suspect. That is the order we follow, and it saves a surprising amount of wasted creative effort.
Mistakes that make tracking misleading
- Averaging all streams together. One strong stream can hide one failing stream for weeks.
- Judging by opens alone. Privacy features inflate them, so a steady open rate is not proof of inbox placement.
- Looking only at your platform’s report. The platform sees what it sent and what came back, not where the mailbox provider placed it.
- Ignoring list sources. The same total complaint rate can mean very different things depending on where the addresses came from.
- Reviewing only after a campaign has gone wrong. By then reputation has already taken the hit, and recovery takes longer than prevention.
- Changing several things at once. If you alter authentication, volume and content in the same week, you will not know which change helped.
Preparing for peak sending
Tracking pays for itself most visibly around Black Friday and the January sales, when volumes spike and every provider is watching for unusual patterns. The baseline tells you how far you can scale without stepping outside your usual pattern, and your daily review catches throttling while there is still time to slow down or segment towards your most engaged recipients. Raising volume gradually, mailing engaged recipients first and holding back long-inactive addresses is the standard way to protect reputation, and your tracking is what tells you whether it is working. Our 48-hour signals checklist is a handy companion when a send starts to look wrong.
When to bring in a specialist
Some teams can run all of this in house, particularly where engineering and lifecycle sit close together. Others find that the work falls between teams: IT owns DNS, marketing owns the sends, and nobody owns the outcome. That is where we come in. Digistrat is a UK email deliverability consultancy, and you work directly with a senior consultant who investigates the problem and implements the agreed fixes alongside your team.
There are a few ways to start, depending on how far along you are:
- Free health check: a first look at authentication, reputation and sending patterns, so you know where to focus. Details are on our deliverability services page.
- Advisory session: a chargeable 90-minute working session for £250 one-off, useful when you have a specific question or want a second opinion on your tracking set-up. See the advisory session page.
- Deliverability Review and Fix: a detailed investigation combined with 45 days of implementation support.
- Managed Deliverability: daily monitoring, incident response, monthly inbox placement testing and one agreed improvement each month, so the tracking described above has a clear owner. More on the Managed Deliverability plan.
If you would rather talk it through first, you can book a free check-up and we will tell you honestly where to look first.
FAQ
What is the difference between email delivery and deliverability?
Delivery means the receiving server accepted your message, so it did not bounce. Deliverability is whether that accepted message reached the inbox rather than spam or another folder. You can have a near-perfect delivery rate and poor deliverability if most of your mail is being filtered into junk.
How can I check whether my emails are going to spam?
Combine three views: the provider dashboards (such as Google Postmaster Tools) for spam rate and reputation, seed testing across several mailbox providers, and engagement trends by stream. No single one is conclusive, but when all three point the same way you can trust the conclusion. Check authentication at the same time, because failures there are a common cause of spam placement.
How often should I review deliverability?
Review large sends daily, compare streams and providers weekly, and run inbox placement tests and list clean-ups monthly. Increase the frequency before peak periods such as Black Friday. The aim is to catch a drift while it is still small enough to fix without hurting revenue.
Is a 25% open rate good?
It can be, but only in context. Published guidance treats around 20% as a reasonable floor and 30 to 40% as typical for engaged lists, yet privacy features inflate opens, so compare against your own baseline for that stream and look at clicks and conversions too.
Sources
- Email sender guidelines FAQ, Gmail Help
- What is the deliverability strategy and how to define it, Adobe Experience League
- The ultimate guide to inbox placement, Spotler
- 8 Email Marketing Metrics and KPIs to Track, Klaviyo UK
- From List Hygiene to Deliverability, Brafton
- Communication dashboard KPIs and definitions, Voyado
- Email Marketing Metrics, Bloomreach documentation
- Create a deliverability baseline, howto.email
- Email Deliverability Plan: Build, Test, Improve, Volanea
- Bulk Sender Compliance: Postmaster, SNDS, Sender Hub